Measuring change and providing insights to your leadership team helps you prove your worth as a Change Manager.
As you interact with stakeholders and deliver change, you amass data to help you create your change plans and validate the success of your change delivery.
These data include:
- pre change readiness results
- stakeholder & audience group sentiments
- adoption measures such as
- how many people visited your SharePoint site
- how many minutes end users spent watching a training video
- results of feedback surveys
Given the large quantities of data that Change Managers generate, work needs to be done before its significance is easily understood by leaders.
- Data is a collection of facts, unanalyzed observations and metrics
- Information puts those facts into context
- “Insights” are the actionable opportunities based on the data and findings
Your data needs to be turned into information and insights to provide value. A little work goes a long way.
An example: A chart doesn’t immediately suggest
This pie chart shows the results of a survey, represented by visually equal segments.

Viewers of the above pie chart need to look closely and take time to make sense of this data.
The solution: Consolidate like segments of the chart

If some components are consolidated, viewers can now quickly see that 57% of respondents were delighted with the change delivery. You can further amplify this message by a text call-out below.
Before presenting data to stakeholders and leaders check that it is easily understood and conveys the ‘golden nugget’ insights that will help these viewers make decisions.
Ask yourself these questions:
- Is it essential that I share this data?
- What information and insights can I see that I need to ensure the viewer will gain?
- Have I made it easy for the viewer to see this immediately?
- Will this data assist decision-making?
- Is the information presented in the most helpful format to communicate the meaning
Add your insights as text boxes or headlines.
To summarise, you start with data but must present information and insights to assist your audience with decision making or comprehension.
Digital platforms automate insight creation & sharing
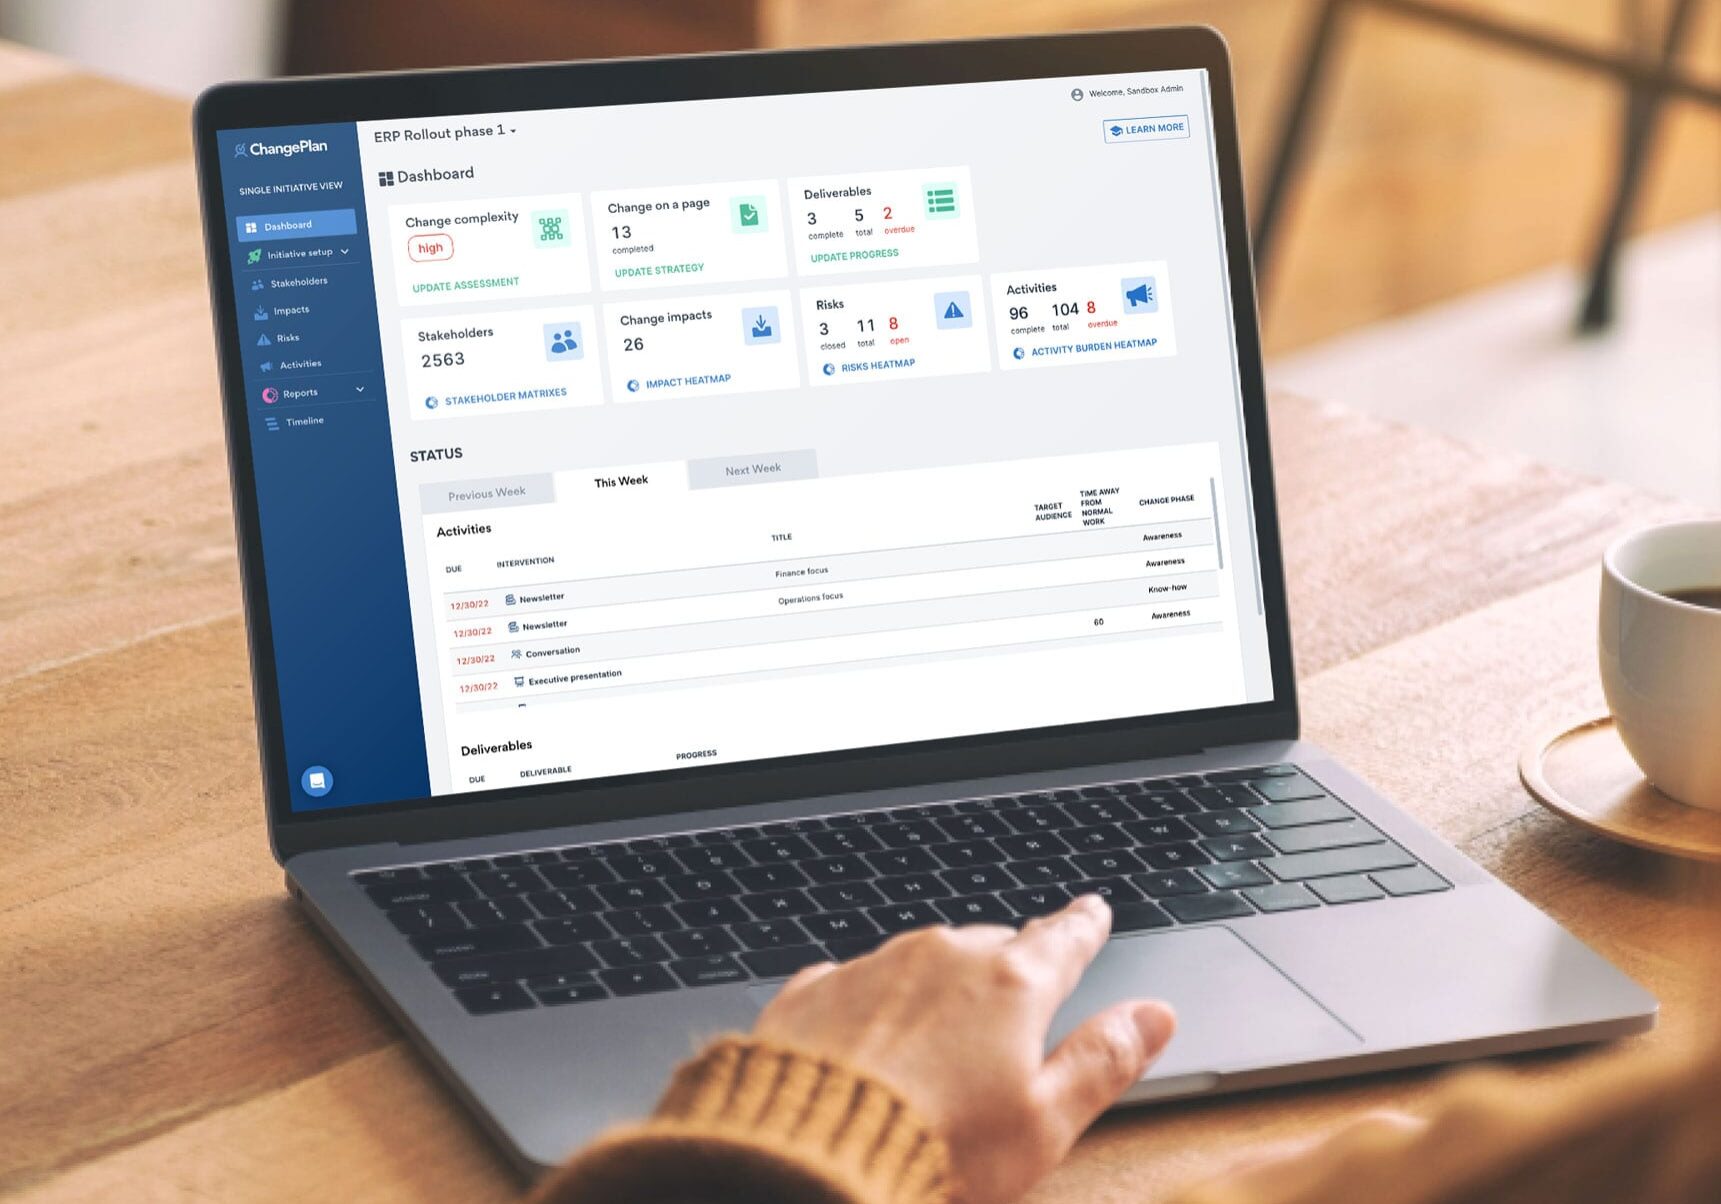
Our platform ChangePlan is designed to automatically turn your data into actionable insights for Change Managers, Change Leads and Leaders via its customizable dashboards. Book your demonstration here.

Three nice resources on presenting information & insights, not just data:
- Book: “The Visual Display of Quantitative Information” by Edward Tufte
- Harvard Business Review (HBR) – Data & Analytics Section
- Change Superhero Templates


